接上文。今天试一下FreeBSD平台
硬件一样的。我推测,FB依然是王者。
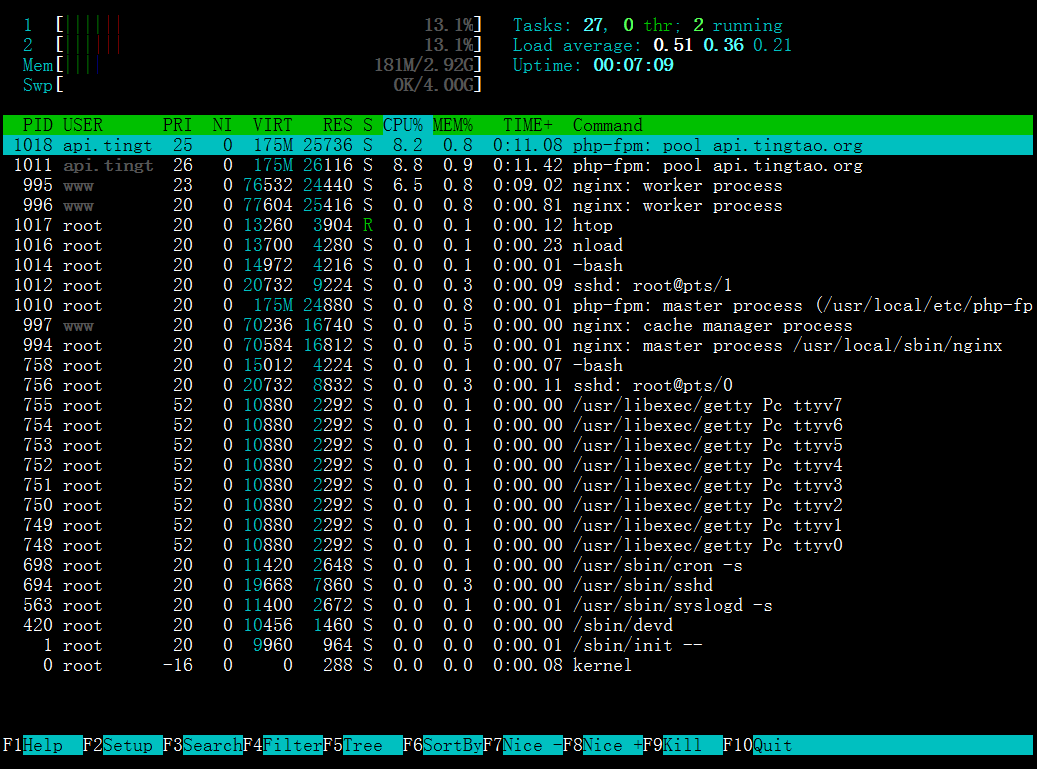
FB的cpu什么的也差不多:
FB的nginx:
Server Software:        Nginx
Server Hostname:        api.tingtao.org
Server Port:            80

Document Path:          /test.php
Document Length:        81848 bytes

Concurrency Level:      1000
Time taken for tests:   111.468 seconds
Complete requests:      10000
Failed requests:        7284
   (Connect: 0, Receive: 0, Length: 7284, Exceptions: 0)
Total transferred:      820124824 bytes
HTML transferred:       818484824 bytes
Requests per second:    89.71 [#/sec] (mean)
Time per request:       11146.837 [ms] (mean)
Time per request:       11.147 [ms] (mean, across all concurrent requests)
Transfer rate:          7185.03 [Kbytes/sec] received

Connection Times (ms)
              min  mean[+/-sd] median   max
Connect:        0   11  73.4      9    3008
Processing:    46 10684 1838.6  12053   12870
Waiting:        3 4132 2405.5   3975    9038
Total:         48 10695 1839.2  12062   15234

Percentage of the requests served within a certain time (ms)
  50%  12062
  66%  12074
  75%  12209
  80%  12233
  90%  12244
  95%  12250
  98%  12254
  99%  12306
 100%  15234 (longest request)
Server Software:        Nginx
Server Hostname:        api.tingtao.org
Server Port:            80

Document Path:          /test.txt
Document Length:        135555 bytes

Concurrency Level:      1000
Time taken for tests:   188.352 seconds
Complete requests:      10000
Failed requests:        0
Total transferred:      1358210000 bytes
HTML transferred:       1355550000 bytes
Requests per second:    53.09 [#/sec] (mean)
Time per request:       18835.177 [ms] (mean)
Time per request:       18.835 [ms] (mean, across all concurrent requests)
Transfer rate:          7042.02 [Kbytes/sec] received

Connection Times (ms)
              min  mean[+/-sd] median   max
Connect:        0   19 186.3      9    9000
Processing:    77 18352 3116.8  18165   36775
Waiting:        1 5872 2519.0   6492   12339
Total:         94 18370 3115.9  18176   36784

Percentage of the requests served within a certain time (ms)
  50%  18176
  66%  19650
  75%  19688
  80%  19798
  90%  21975
  95%  22001
  98%  22031
  99%  27437
 100%  36784 (longest request)
apache:
Server Software:        Apache/2.4.46
Server Hostname:        api.tingtao.org
Server Port:            80

Document Path:          /test.php
Document Length:        82687 bytes

Concurrency Level:      1000
Time taken for tests:   121.300 seconds
Complete requests:      10000
Failed requests:        915
   (Connect: 0, Receive: 0, Length: 915, Exceptions: 0)
Total transferred:      828507938 bytes
HTML transferred:       826867938 bytes
Requests per second:    82.44 [#/sec] (mean)
Time per request:       12129.994 [ms] (mean)
Time per request:       12.130 [ms] (mean, across all concurrent requests)
Transfer rate:          6670.16 [Kbytes/sec] received

Connection Times (ms)
              min  mean[+/-sd] median   max
Connect:        0   12  94.7      9    3009
Processing:    75 11628 1606.8  12078   15122
Waiting:        4 4486 2597.4   4474    9018
Total:         79 11640 1608.2  12087   15131

Percentage of the requests served within a certain time (ms)
  50%  12087
  66%  12093
  75%  12096
  80%  12098
  90%  12107
  95%  12120
  98%  12150
  99%  12269
 100%  15131 (longest request)
apache的文本文件无法完成,有点晕了,因为之前没在FreeBSD上用过Apache,所以不太会调,试着改了几次参数都不行,但参考php的数据可以得知,如果调整好的话,应该比Nginx低1%左右吧,或者干脆就一样,因为Linux和FB平台的纯文本响应效率都是53左右。
奇葩的是,FB系统+Nginx在ab文本文件的时候CPU低的离谱,只有3%到4%左右,这个比linux强太多。
于是暂时得出结论是,如果是php类的应用并且负载很高,那
FB比Linux的Nginx强23%左右
FB比Linux的Apache24强7%左右
如果选择Linux是必须的,那么Apache比Nginx强5.4%左右
如果FB系统,那么Nginx比Apache强8.8%左右
但是需要注意的是,Nginx的出错率超过Apache,具体数据文中都有。
周末了,等会再试试Windows系统下情况,如果不出意外,Win+Apache可能是最差的一个,但主观估计与Linux不会差太多。
=========================== 补充
Apache按照如下参数设置:
<IfModule mpm event module>
    ServerLimit     1000
    StartServers    20
    MinSpareThreads     25
    MaxSpareThreads     1200
    ThreadsPerChild     2000
    MaxRequestWorkers       2000
    MaxC onnectionsPerChild 1000
</IfModule>
然后php结果:
Server Software:        Apache/2.4.46
Server Hostname:        api.tingtao.org
Server Port:            80

Document Path:          /test.php
Document Length:        82297 bytes

Concurrency Level:      1000
Time taken for tests:   120.937 seconds
Complete requests:      10000
Failed requests:        1042
   (Connect: 0, Receive: 0, Length: 1042, Exceptions: 0)
Total transferred:      824447684 bytes
HTML transferred:       822967684 bytes
Requests per second:    82.69 [#/sec] (mean)
Time per request:       12093.692 [ms] (mean)
Time per request:       12.094 [ms] (mean, across all concurrent requests)
Transfer rate:          6657.39 [Kbytes/sec] received

Connection Times (ms)
              min  mean[+/-sd] median   max
Connect:        0   12  94.6      9    3008
Processing:    72 11631 1607.1  12078   15094
Waiting:        4 4490 2596.2   4479    9031
Total:         76 11643 1608.5  12087   15129

Percentage of the requests served within a certain time (ms)
  50%  12087
  66%  12097
  75%  12106
  80%  12111
  90%  12126
  95%  12142
  98%  12170
  99%  12175
 100%  15129 (longest request)
运行了两次,基本一致
然后看静态文件依然无法完成。
我试着把php-fpm的性能参数提高100倍,得出的结果也只能提升到85.31 [#/sec] (mean) ,也就是说FreeBSD系统在这个渣渣硬件上的极限大概就这样了。