以前的Apache+mpm_work模式确实不太行,占资源挺多,还容易崩,所以近几年我也在用Nginx,最近因为一些功能如果用Nginx的话则需要多加几个软件支持,所以最近切回Apache了,但感觉也并不差,所以今天全面测试了一下。
模拟服务器的环境:从亲戚那里拿来的报废笔记本一台,配置为
Celeron(R) Dual-Core CPU T3000 @ 1.80GHz
3G内存
160G 7200rpm硬盘
网络是有线局域网100M
操作系统为 Ubuntu 20.4.1,更新了。
模拟客户端的机器为
E3-1230 V3
16G ECC
500G ssd+2T hd+2T hd
操作系统 win7 企业版,从不打补丁……
Apache2:
Server version: Apache/2.4.41 (Ubuntu)
Server built:   2020-04-13T17:19:17
Server's Module Magic Number: 20120211:88
Server loaded:  APR 1.6.5, APR-UTIL 1.6.1
Compiled using: APR 1.6.5, APR-UTIL 1.6.1
Architecture:   64-bit
Server MPM:
Server compiled with....
 -D APR_HAS_SENDFILE
 -D APR_HAS_MMAP
 -D APR_HAVE_IPV6 (IPv4-mapped addresses enabled)
 -D APR_USE_SYSVSEM_SERIALIZE
 -D APR_USE_PTHREAD_SERIALIZE
 -D SINGLE_LISTEN_UNSERIALIZED_ACCEPT
 -D APR_HAS_OTHER_CHILD
 -D AP_HAVE_RELIABLE_PIPED_LOGS
 -D DYNAMIC_MODULE_LIMIT=256
 -D HTTPD_ROOT="/etc/apache2"
 -D SUEXEC_BIN="/usr/lib/apache2/suexec"
 -D DEFAULT_PIDLOG="/var/run/apache2.pid"
 -D DEFAULT_SCOREBOARD="logs/apache_runtime_status"
 -D DEFAULT_ERRORLOG="logs/error_log"
 -D AP_TYPES_CONFIG_FILE="mime.types"
 -D SERVER_CONFIG_FILE="apache2.conf"
Nginx:
root@homesvr:/etc/apache2# nginx -V
nginx version: nginx/1.18.0 (Ubuntu)
built with OpenSSL 1.1.1f  31 Mar 2020
TLS SNI support enabled
configure arguments: --with-cc-opt='-g -O2 -fdebug-prefix-map=/build/nginx-5J5hor/nginx-1.18.0=. -fstack-protector-strong -Wformat -Werror=format-security -fPIC -Wdate-time -D_FORTIFY_SOURCE=2' --with-ld-opt='-Wl,-Bsymbolic-functions -Wl,-z,relro -Wl,-z,now -fPIC' --prefix=/usr/share/nginx --conf-path=/etc/nginx/nginx.conf --http-log-path=/var/log/nginx/access.log --error-log-path=/var/log/nginx/error.log --lock-path=/var/lock/nginx.lock --pid-path=/run/nginx.pid --modules-path=/usr/lib/nginx/modules --http-client-body-temp-path=/var/lib/nginx/body --http-fastcgi-temp-path=/var/lib/nginx/fastcgi --http-proxy-temp-path=/var/lib/nginx/proxy --http-scgi-temp-path=/var/lib/nginx/scgi --http-uwsgi-temp-path=/var/lib/nginx/uwsgi --with-debug --with-compat --with-pcre-jit --with-http_ssl_module --with-http_stub_status_module --with-http_realip_module --with-http_auth_request_module --with-http_v2_module --with-http_dav_module --with-http_slice_module --with-threads --with-http_addition_module --with-http_flv_module --with-http_geoip_module=dynamic --with-http_gunzip_module --with-http_gzip_static_module --with-http_image_filter_module=dynamic --with-http_mp4_module --with-http_perl_module=dynamic --with-http_random_index_module --with-http_secure_link_module --with-http_sub_module --with-http_xslt_module=dynamic --with-mail=dynamic --with-mail_ssl_module --with-stream=dynamic --with-stream_ssl_module --with-stream_ssl_preread_module --add-dynamic-module=/build/nginx-5J5hor/nginx-1.18.0/debian/modules/http-headers-more-filter --add-dynamic-module=/build/nginx-5J5hor/nginx-1.18.0/debian/modules/http-auth-pam --add-dynamic-module=/build/nginx-5J5hor/nginx-1.18.0/debian/modules/http-cache-purge --add-dynamic-module=/build/nginx-5J5hor/nginx-1.18.0/debian/modules/http-dav-ext --add-dynamic-module=/build/nginx-5J5hor/nginx-1.18.0/debian/modules/http-ndk --add-dynamic-module=/build/nginx-5J5hor/nginx-1.18.0/debian/modules/http-echo --add-dynamic-module=/build/nginx-5J5hor/nginx-1.18.0/debian/modules/http-fancyindex --add-dynamic-module=/build/nginx-5J5hor/nginx-1.18.0/debian/modules/nchan --add-dynamic-module=/build/nginx-5J5hor/nginx-1.18.0/debian/modules/http-lua --add-dynamic-module=/build/nginx-5J5hor/nginx-1.18.0/debian/modules/rtmp --add-dynamic-module=/build/nginx-5J5hor/nginx-1.18.0/debian/modules/http-uploadprogress --add-dynamic-module=/build/nginx-5J5hor/nginx-1.18.0/debian/modules/http-upstream-fair --add-dynamic-module=/build/nginx-5J5hor/nginx-1.18.0/debian/modules/http-subs-filter --add-dynamic-module=/build/nginx-5J5hor/nginx-1.18.0/debian/modules/http-geoip2
php:
PHP 7.4.3 (cli) (built: May 26 2020 12:24:22) ( NTS )
Copyright (c) The PHP Group
Zend Engine v3.4.0, Copyright (c) Zend Technologies
    with Zend OPcache v7.4.3, Copyright (c), by Zend Technologies
跟PHP其实没多大关系,因为php是固定的php-fpm,两个web服务器都是通过sock文件直连这个php-fpm的,全程下来php-fpm没有任何变动,甚至连重启都没有。
Apache分别测试了prefork和event两个模型,参数配置如下
<IfModule mpm_event_module>
ThreadLimit         256
ServerLimit         256
StartServers         8
MaxClients           10000
ThreadsPerChild     256
MaxRequestsPerChild  10000
</IfModule>


<IfModule mpm_prefork_module>
StartServers          5
MinSpareServers       5
MaxSpareServers      10
MaxClients          150
MaxRequestsPerChild   0

</IfModule>
nginx跟性能有关的参数:
use   epoll;
worker_connections  20000;
ab的命令:
ab -c 1000 -n 10000 http://api.tingtao.org/test.php
ab -c 1000 -n 10000 http://api.tingtao.org/test.txt
分别测试了静态文件和php,一个是phpinfo,一个是随意写了130多K的文本,结果如下
nginx:

Apache prefork:
Apache event:
系统状态大体都是一样的:
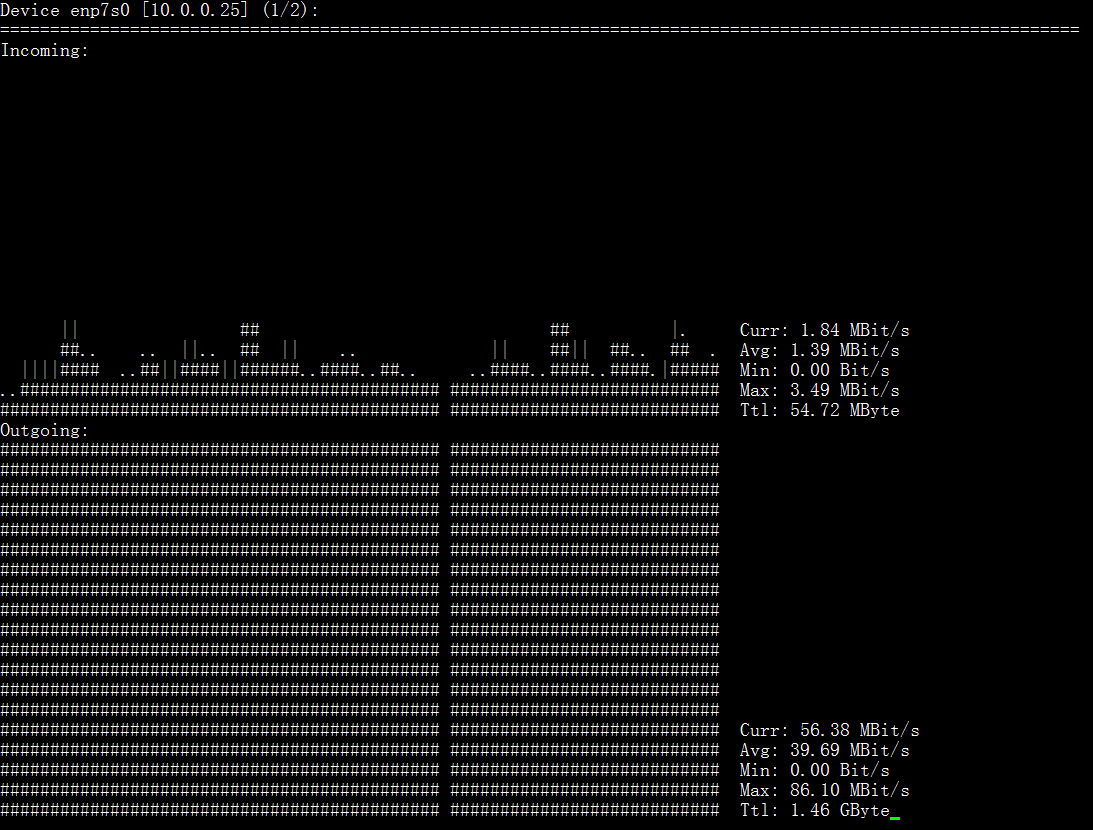
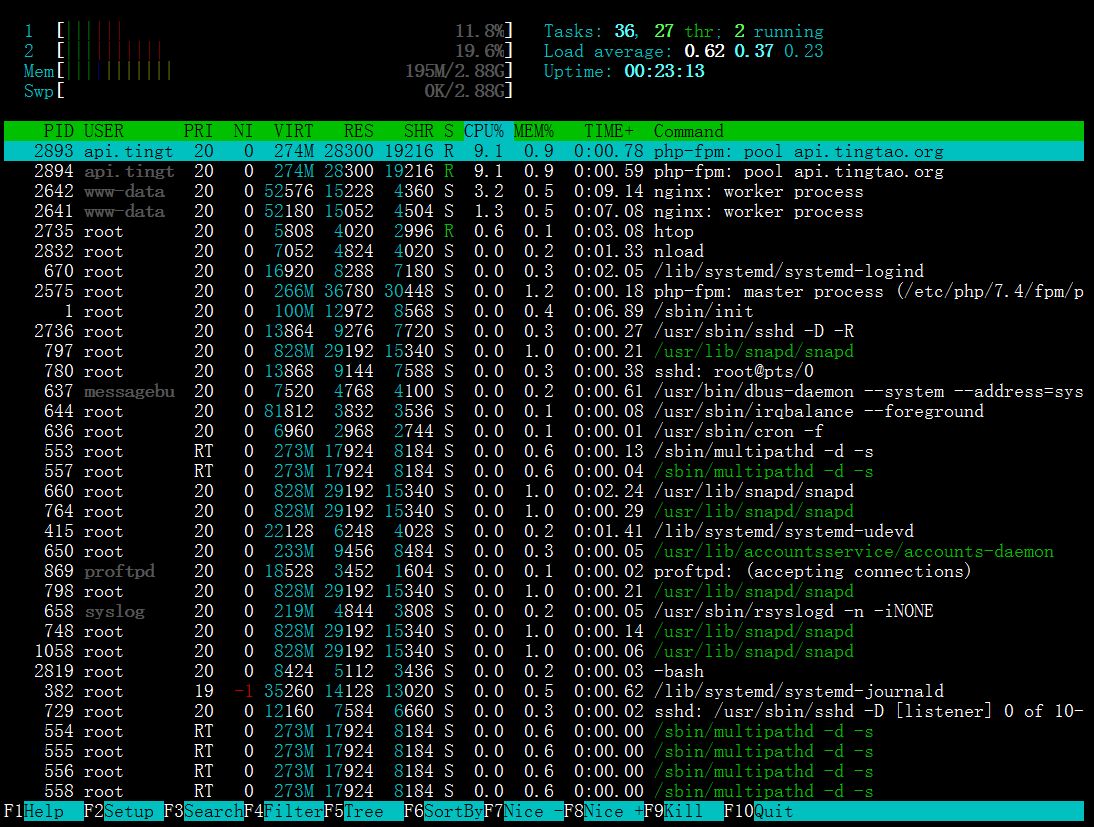
系统状态差别不大,apache的内存多用了5到15M左右,prefork的cpu多了5%到10%左右,其他的基本完全一致,也就没抓图了。
从数据来看,受限于这个渣渣硬盘,所以几个模式下静态文件的处理也都逼近硬件极限了,没什么区别。
而与php-fpm的通信情况来看,其实也没什么区别,但出人意表的是apache2+mpm_event的效率是最高的,虽然这个差距并不大。
后来我猜这个渣硬盘可能会坑爹,于是我把文件放内存里了,同时把web日志全关掉了,又跑了一遍mpm_event和nginx,结果是这样的:
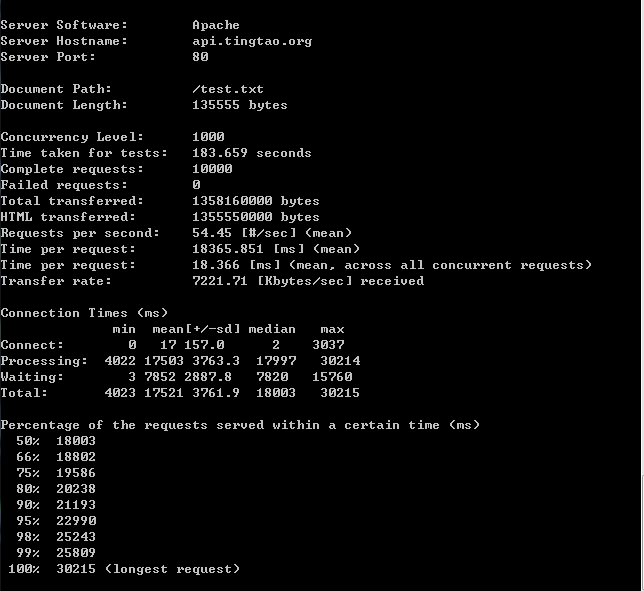
apache mpm_event:
Server Software: Apache
Server Hostname: api.tingtao.org
Server Port: 80
Document Path: /test.txt
Document Length: 135555 bytes
Concurrency Level: 1000
Time taken for tests: 196.759 seconds
Complete requests: 10000
Failed requests: 0
Total transferred: 1358160000 bytes
HTML transferred: 1355550000 bytes
Requests per second: 50.82 [#/sec] (mean)
Time per request: 19675.884 [ms] (mean)
Time per request: 19.676 [ms] (mean, across all concurrent requests)
Transfer rate: 6740.88 [Kbytes/sec] received
Connection Times (ms)
min mean[+/-sd] median max
Connect: 0 19 119.5 3 1080
Processing: 383 18983 3739.2 19327 38574
Waiting: 3 4699 2421.9 4816 13014
Total: 391 19002 3738.4 19352 38594
Percentage of the requests served within a certain time (ms)
50% 19352
66% 20058
75% 20666
80% 20824
90% 21740
95% 21959
98% 26565
99% 29219
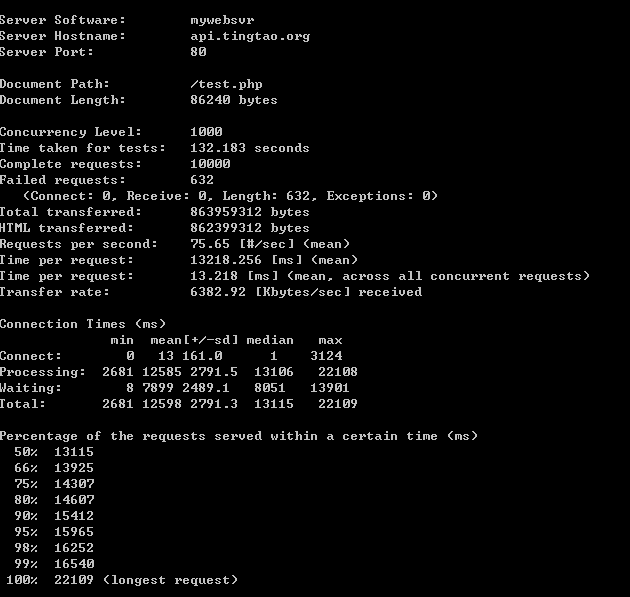
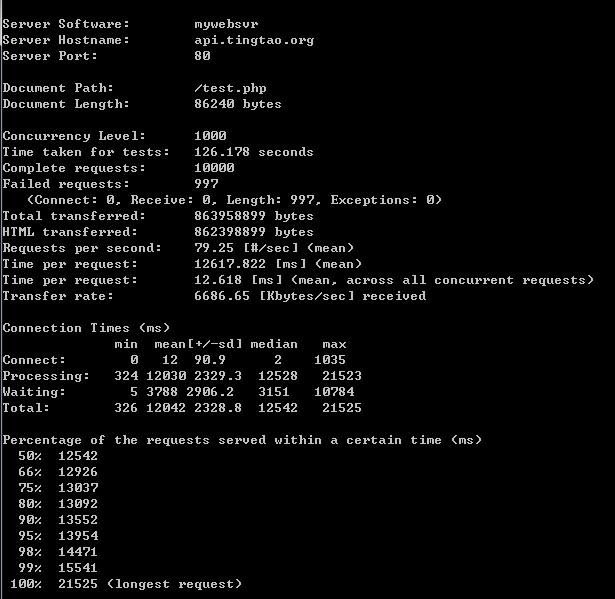
100% 38594 (longest request)Server Software: mywebsvr
Server Hostname: api.tingtao.org
Server Port: 80
Document Path: /test.php
Document Length: 86232 bytes
Concurrency Level: 1000
Time taken for tests: 130.361 seconds
Complete requests: 10000
Failed requests: 1003
(Connect: 0, Receive: 0, Length: 1003, Exceptions: 0)
Total transferred: 863878890 bytes
HTML transferred: 862318890 bytes
Requests per second: 76.71 [#/sec] (mean)
Time per request: 13036.121 [ms] (mean)
Time per request: 13.036 [ms] (mean, across all concurrent requests)
Transfer rate: 6471.49 [Kbytes/sec] received
Connection Times (ms)
min mean[+/-sd] median max
Connect: 0 13 98.7 2 3119
Processing: 109 12692 2516.2 13069 20763
Waiting: 4 4712 3119.6 4415 11650
Total: 109 12705 2514.9 13075 20766
Percentage of the requests served within a certain time (ms)
50% 13075
66% 13471
75% 14125
80% 14430
90% 15002
95% 15491
98% 17846
99% 18300
100% 20766 (longest request)
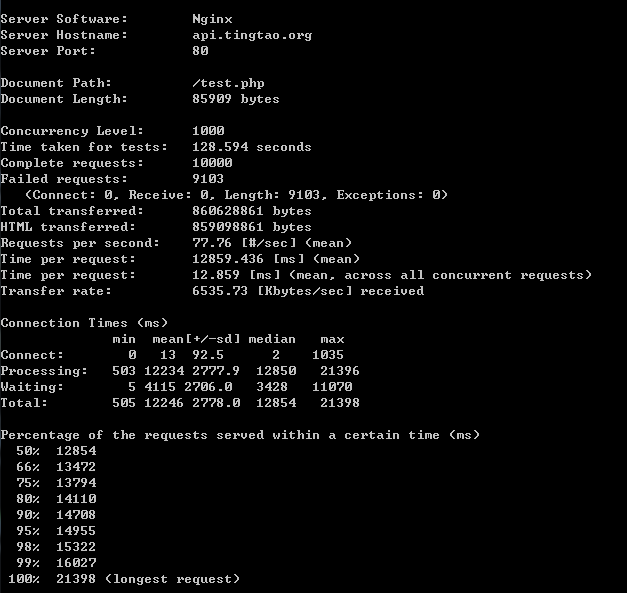
nginx的:
Server Software: Nginx
Server Hostname: api.tingtao.org
Server Port: 80
Document Path: /test.txt
Document Length: 135555 bytes
Concurrency Level: 1000
Time taken for tests: 187.040 seconds
Complete requests: 10000
Failed requests: 0
Total transferred: 1358100000 bytes
HTML transferred: 1355550000 bytes
Requests per second: 53.46 [#/sec] (mean)
Time per request: 18704.035 [ms] (mean)
Time per request: 18.704 [ms] (mean, across all concurrent requests)
Transfer rate: 7090.82 [Kbytes/sec] received
Connection Times (ms)
min mean[+/-sd] median max
Connect: 0 18 115.5 0 3003
Processing: 593 17890 3459.3 18253 34382
Waiting: 0 4099 2316.9 4267 13229
Total: 593 17907 3459.4 18287 34429
Percentage of the requests served within a certain time (ms)
50% 18287
66% 18782
75% 19318
80% 19559
90% 20607
95% 22027
98% 23962
99% 26442
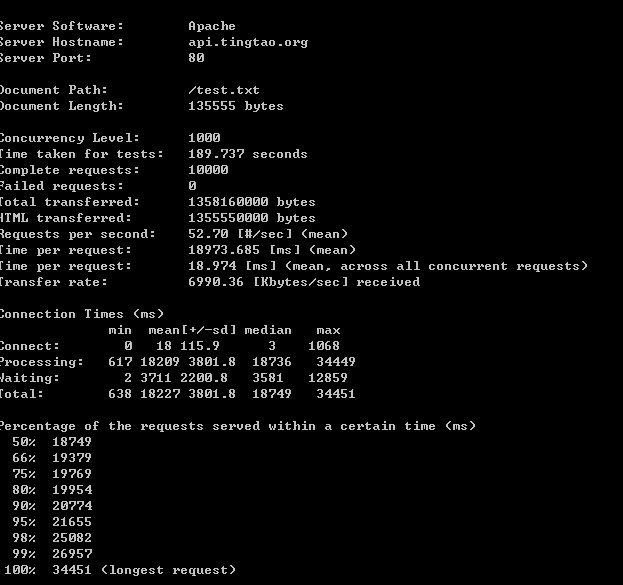
100% 34429 (longest request)Server Software: Nginx
Server Hostname: api.tingtao.org
Server Port: 80
Document Path: /test.php
Document Length: 85902 bytes
Concurrency Level: 1000
Time taken for tests: 137.439 seconds
Complete requests: 10000
Failed requests: 1024
(Connect: 0, Receive: 0, Length: 1024, Exceptions: 0)
Total transferred: 860548863 bytes
HTML transferred: 859018863 bytes
Requests per second: 72.76 [#/sec] (mean)
Time per request: 13743.941 [ms] (mean)
Time per request: 13.744 [ms] (mean, across all concurrent requests)
Transfer rate: 6114.55 [Kbytes/sec] received
Connection Times (ms)
min mean[+/-sd] median max
Connect: 0 13 97.4 0 1045
Processing: 199 13042 2663.9 13388 23753
Waiting: 0 3258 2546.8 2894 12911
Total: 199 13056 2663.2 13400 23753
Percentage of the requests served within a certain time (ms)
50% 13400
66% 13918
75% 14343
80% 14551
90% 15305
95% 15735
98% 16230
99% 18039
100% 23753 (longest request)
这么一来,数据就有意思了,Apache连接php-fpm的性能依然比Nginx高6%左右,而静态文件不出意外的比Nginx低5%左右。
这里要特别说明一下的是,细心的你可能会发现Apache的测试经常会显示为“mywebsvr”,这是因为我是按照自己的脚本做的一套完整环境,也就是说Apache其实多加载了十几个测试用不到的模块,这里必然会产生性能损失,所以推测一下的话,如果单纯为了跑分而设置,那么Apache的性能应该会更高一点,也就是说可能完全不输Nginx的。
于是我更纳闷了,按我想法来说,性能较低的硬件更能表现出软件的实际处理能力,所以我自己动手测试的结果应该是真实有效的,那么网上各种流传的Nginx性能多牛B,从何体现?又是怎么得出结论的?
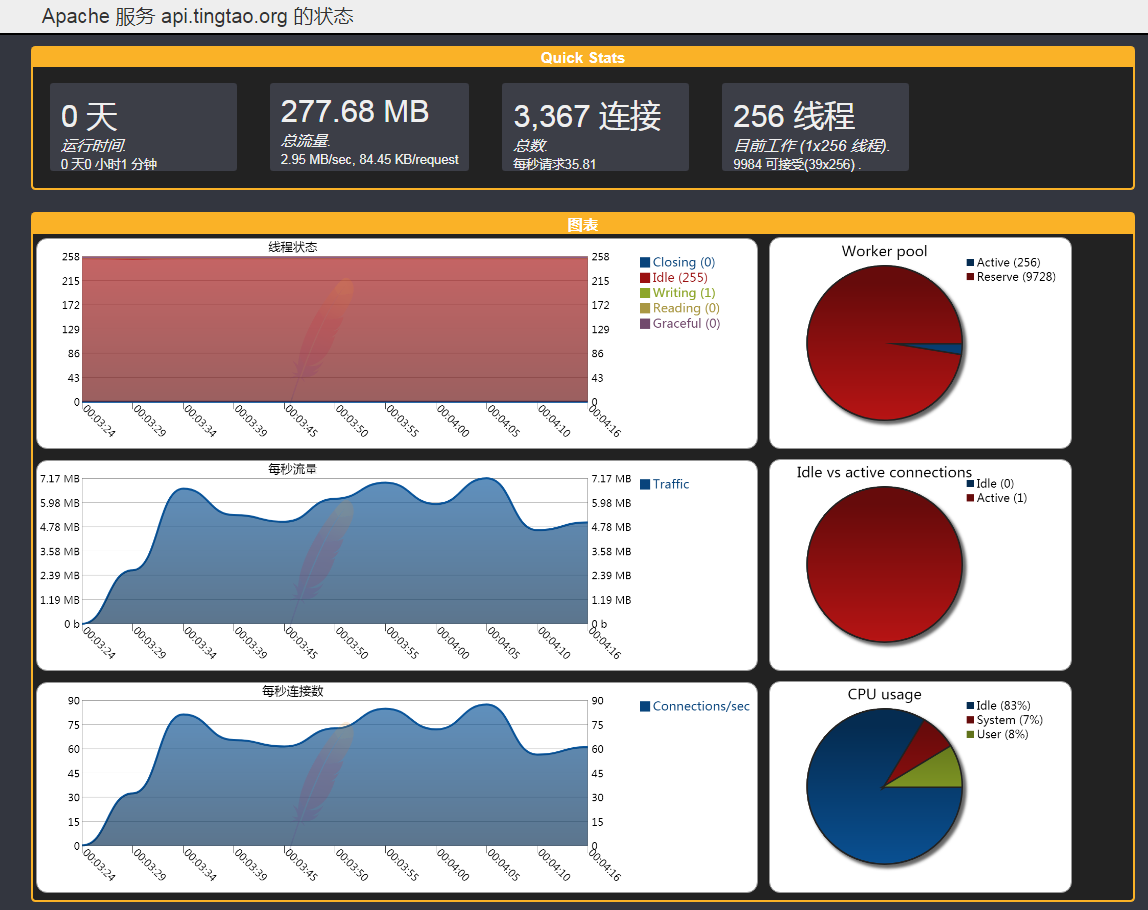
apache服务器性能数据和ab的结果数据是一致的,这肯定骗不了人的。
所以,个人看法,其实到底哪个更好,这不是最重要的。能得出自己的结论,这才重要。